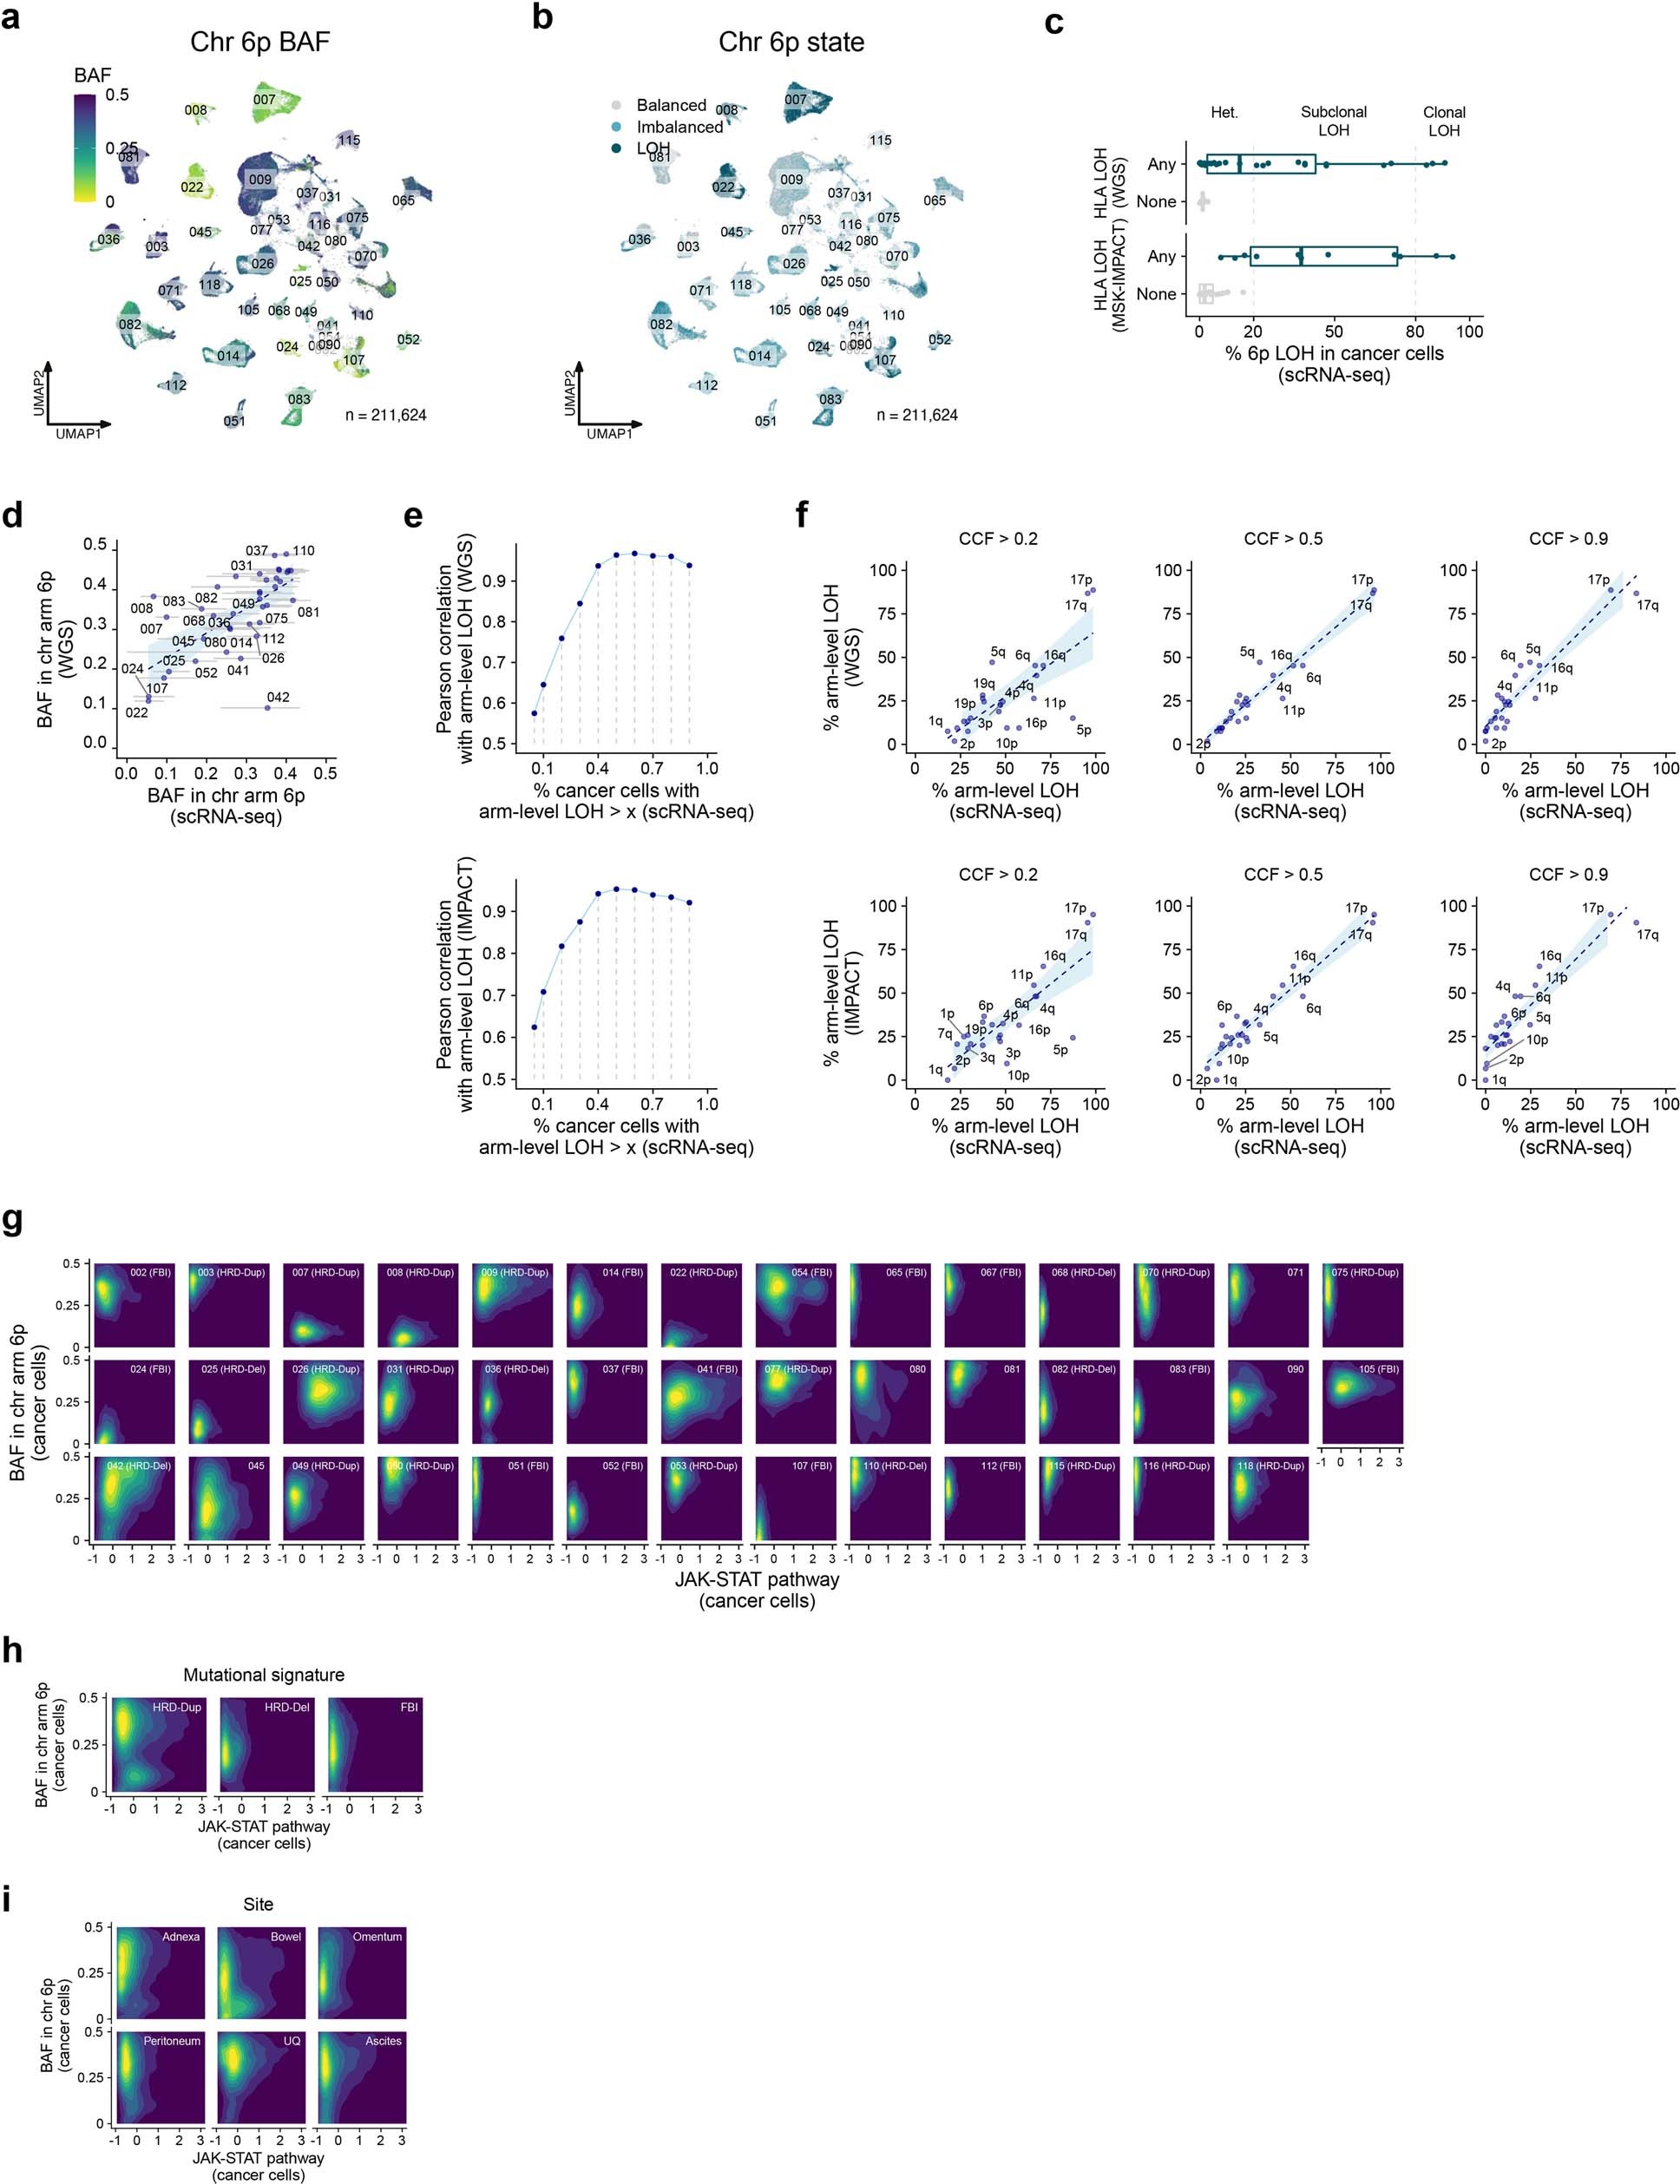
Extended Data Fig. 12: Intratumour heterogeneity of HLA loss of heterozygosity.
From:Ovarian cancer mutational processes drive site-specific immune evasion

a, UMAP of cancer cells profiled by scRNA-seq coloured by BAF of chromosome arm 6p.b, Allelic state of chromosome arm 6p. Allelic imbalance states per cell are assigned based on the mean 6p BAF per cell as balanced (BAF ≥ 0.35), imbalanced (0.15 ≤ BAF < 0.35) or LOH (BAF < 0.15) (Methods).c, Validation of 6p LOH estimates in cancer cells profiled by scRNA-seq using HLA LOH status in site-matched WGS samples (top) and site-matched MSK-IMPACT samples (bottom). 32 out of 41 patients profiled by scRNA-seq have site-matched WGS data, and 31 out of 41 patients have site-matched MSK-IMPACT data. Box plots show the median, top and bottom quartiles; whiskers correspond to 1.5× IQR.d, Correlation between arm-level BAF estimates inferred by scRNA-seq and WGS.e, Rarefaction curve of the arm-level LOH landscape detected by scRNA-seq, correlating the landscape of events at increasing cancer cell fractions in scRNA-seq to WGS (top) and MSK-IMPACT (bottom).f, Correlation between the fraction of samples with arm-level LOH in scRNA-seq and WGS (top), and in scRNA-seq and MSK-IMPACT (bottom), at increasing scRNA-seq cancer cell fractions.g, Normalized density contours of 6p BAF and JAK-STAT pathway activity in cancer cells for each patient.h–i, Normalized density contours of 6p BAF and JAK-STAT pathway activity in cancer cells comparing mutational signatures (h) and anatomic sites of origin (i). Inc–i, only scRNA-seq BAF estimates from cells with ≥ 10 reads aligning to chromosome arm 6p are considered, and allelic imbalance states are assigned per cell based on the mean 6p BAF per cell as balanced (BAF ≥ 0.35), imbalanced (0.15 ≤ BAF < 0.35) or LOH (BAF < 0.15) (Methods).
